Only 30 percent of digital transformations meet or exceed their target value, according to BCG research across more than 850 companies. Another 44 percent produce some value and miss their targets. The rest deliver less than half of what was promised.
The gap is rarely in technology. It sits in the measurement — the objective nobody made specific enough to fail, the baseline nobody captured, the costs that never reached the business case. Digital transformation ROI is the number that exposes all of it, and most organizations cannot produce one they would defend in front of a board.
Executives can explain why they bought digital transformation services. Modernize the stack. Serve customers better. Compete with someone moving faster. Ask what the investment returned, and the answer arrives as a story with a chart attached. But it is not survivable now, when year three gets approved on the evidence produced by years one and two.
This guide covers how to measure ROI of digital transformation. We’ll cover the formula with a worked example, a six-step framework, digital transformation ROI metrics by category, and what changes at enterprise scale.
What Is Digital Transformation ROI?
Digital transformation ROI is the measurable business value an organization gains from its digital initiatives relative to their total cost. It covers direct financial returns — revenue growth and cost savings — as well as operational, customer, and workforce improvements.
The first is scope. A server consolidation has one kind of return: the invoice gets smaller. Transformation rarely behaves that way. Tangible returns show up in cost per transaction, revenue per customer, cycle time, and error rates. Customer experience, adoption, and decision quality sit alongside them and resist the same treatment. Leaving those out understates the return as badly as inventing a number overstates it.
The second is the horizon. Point automations pay back fast, because the baseline is narrow and the change touches one team. Enterprise programs take 12 to 24 months before the numbers stabilize, and the first six usually look like pure cost. A CFO approving year three needs evidence that years one and two produced something, and "the platform is more modern" does not survive an audit committee.
Why Measuring the ROI of Digital Transformation Is Hard
Moving from a departmental project to an enterprise program changes what digital transformation consulting has to deliver. It transforms cost across capital and operating budgets, spreads benefit across business units that never shared a reporting line, and spreads both across a horizon longer than most programs have patience for. Standard investment math assumes a clean boundary around the thing being measured. Transformation programs do not have one.
Intangible Benefits Resist Quantification
The accounting problem is getting worse. Ocean Tomo's Intangible Asset Market Value Study puts intangibles at roughly 92 percent of S&P 500 market capitalization as of 2025, against 17 percent in 1975. Corporate value moved, BUT measurement mostly did not.
A support team resolving issues in six minutes instead of nineteen has produced something valuable. Naming its value in dollars requires a chain: minutes saved, agents freed, churn avoided, revenue retained. Each link is defensible alone. Stacked, they produce a figure a CFO can challenge on any one of four grounds.
The answer is proxy metrics with disclosed logic: adoption as a share of eligible users, customer satisfaction against a pre-initiative baseline, error and rework rates, and cycle time. The last two convert to money with little argument. The first two do not, so report them as directional evidence with the conversion assumption stated in the open. A board that sees the assumption can accept it. But a board that discovers it later stops trusting the model.
Hidden and Indirect Costs
Most business cases price the software and underprice everything required to make people use it. The Oxford study of 1,471 IT projects by Flyvbjerg and Budzier found an average cost overrun of 27 percent, with one project in six overrunning by 200 percent.
Licensing and infrastructure land in the model early because vendors quote them. Training hours come out of operating budgets nobody mapped to the initiative. Integration expands once the team discovers the legacy system exposes data through a nightly batch file rather than an API. Change management gets funded when adoption stalls in month five. Internal support time never generates an invoice, which is exactly why it escapes the denominator.
ROI divides net benefit by total cost. Understate it and every early claim inflates, sometimes by enough to keep a failing program funded through another budget cycle.
Long and Uneven Time Horizons
An invoice automation and a core platform replacement do not belong on the same reporting calendar. Most portfolios put them there anyway, because the quarterly review has one template. The same Oxford dataset found schedule overruns near 70 percent among its worst-performing sixth, which makes the calendar one of the least reliable assumptions in any plan.
Quick wins look excellent at 90 days. Structural investments look like pure spend at the same checkpoint. This is because platform work that unlocks four downstream use cases returns nothing measurable until two ship. Judge both on the same schedule and the portfolio learns an expensive lesson: propose the small thing.
Different classes need different windows:
- Point automation — three to six months, on cycle time and labor hours.
- Function-level digital transformation — six to 18 months, with the first two quarters showing cost only.
- Platform and data foundation — 18 to 24 months, on enablement rather than direct return.
- Enterprise-wide transformation — 12 to 24 months at portfolio level.
Measuring a data foundation on direct return always produces a bad number, because the return belongs to something else. Measure it on how long each dependent initiative took to reach production against the pre-platform baseline.
Attribution Across Parallel Initiatives
Cloud migration, process automation, and an AI pilot all land in the same fiscal year. Order fulfillment gets faster, and three teams claim it. PwC's 2026 Digital Trends in Operations survey reports that 58 percent of 767 operations executives, only 51 percent said their companies establish a clean, structured data foundation before scaling digital initiatives. About half start without the basis for isolating what any one program did.
Three practices make for better efficiency:
- Baseline per initiative, not per program — capture the metrics each one claims to move, dated, before its first release.
- Stagger releases where the calendar allows — four to six weeks between initiatives touching the same process buys a clean read.
- Assign shared gains explicitly — when isolation is impossible, split the credit in the model and say so.
Data Silos and Inconsistent Measurement
Ask four departments for the cost per order and get four answers. None is wrong inside its own system. In the same PwC survey, 87 percent of operations leaders said poor data quality has affected their organization's ability to achieve value from digital initiatives.
Finance counts fulfillment labor, but operations excludes it. The warehouse platform measures pick-to-ship, the ERP order entry to invoice. Pulled into one report, they produce a number nobody will sign.
Measuring ROI of digital transformation, two things have to exist before the first initiative ships. A shared metric dictionary: one definition per metric, naming the source system, the calculation, the owner, and what the number excludes. And centralized reporting: one pipeline where metrics land automatically. Neither is a reporting task. Both are governance decisions, and both cost far less in month one than in month 20.
How to Calculate Digital Transformation ROI
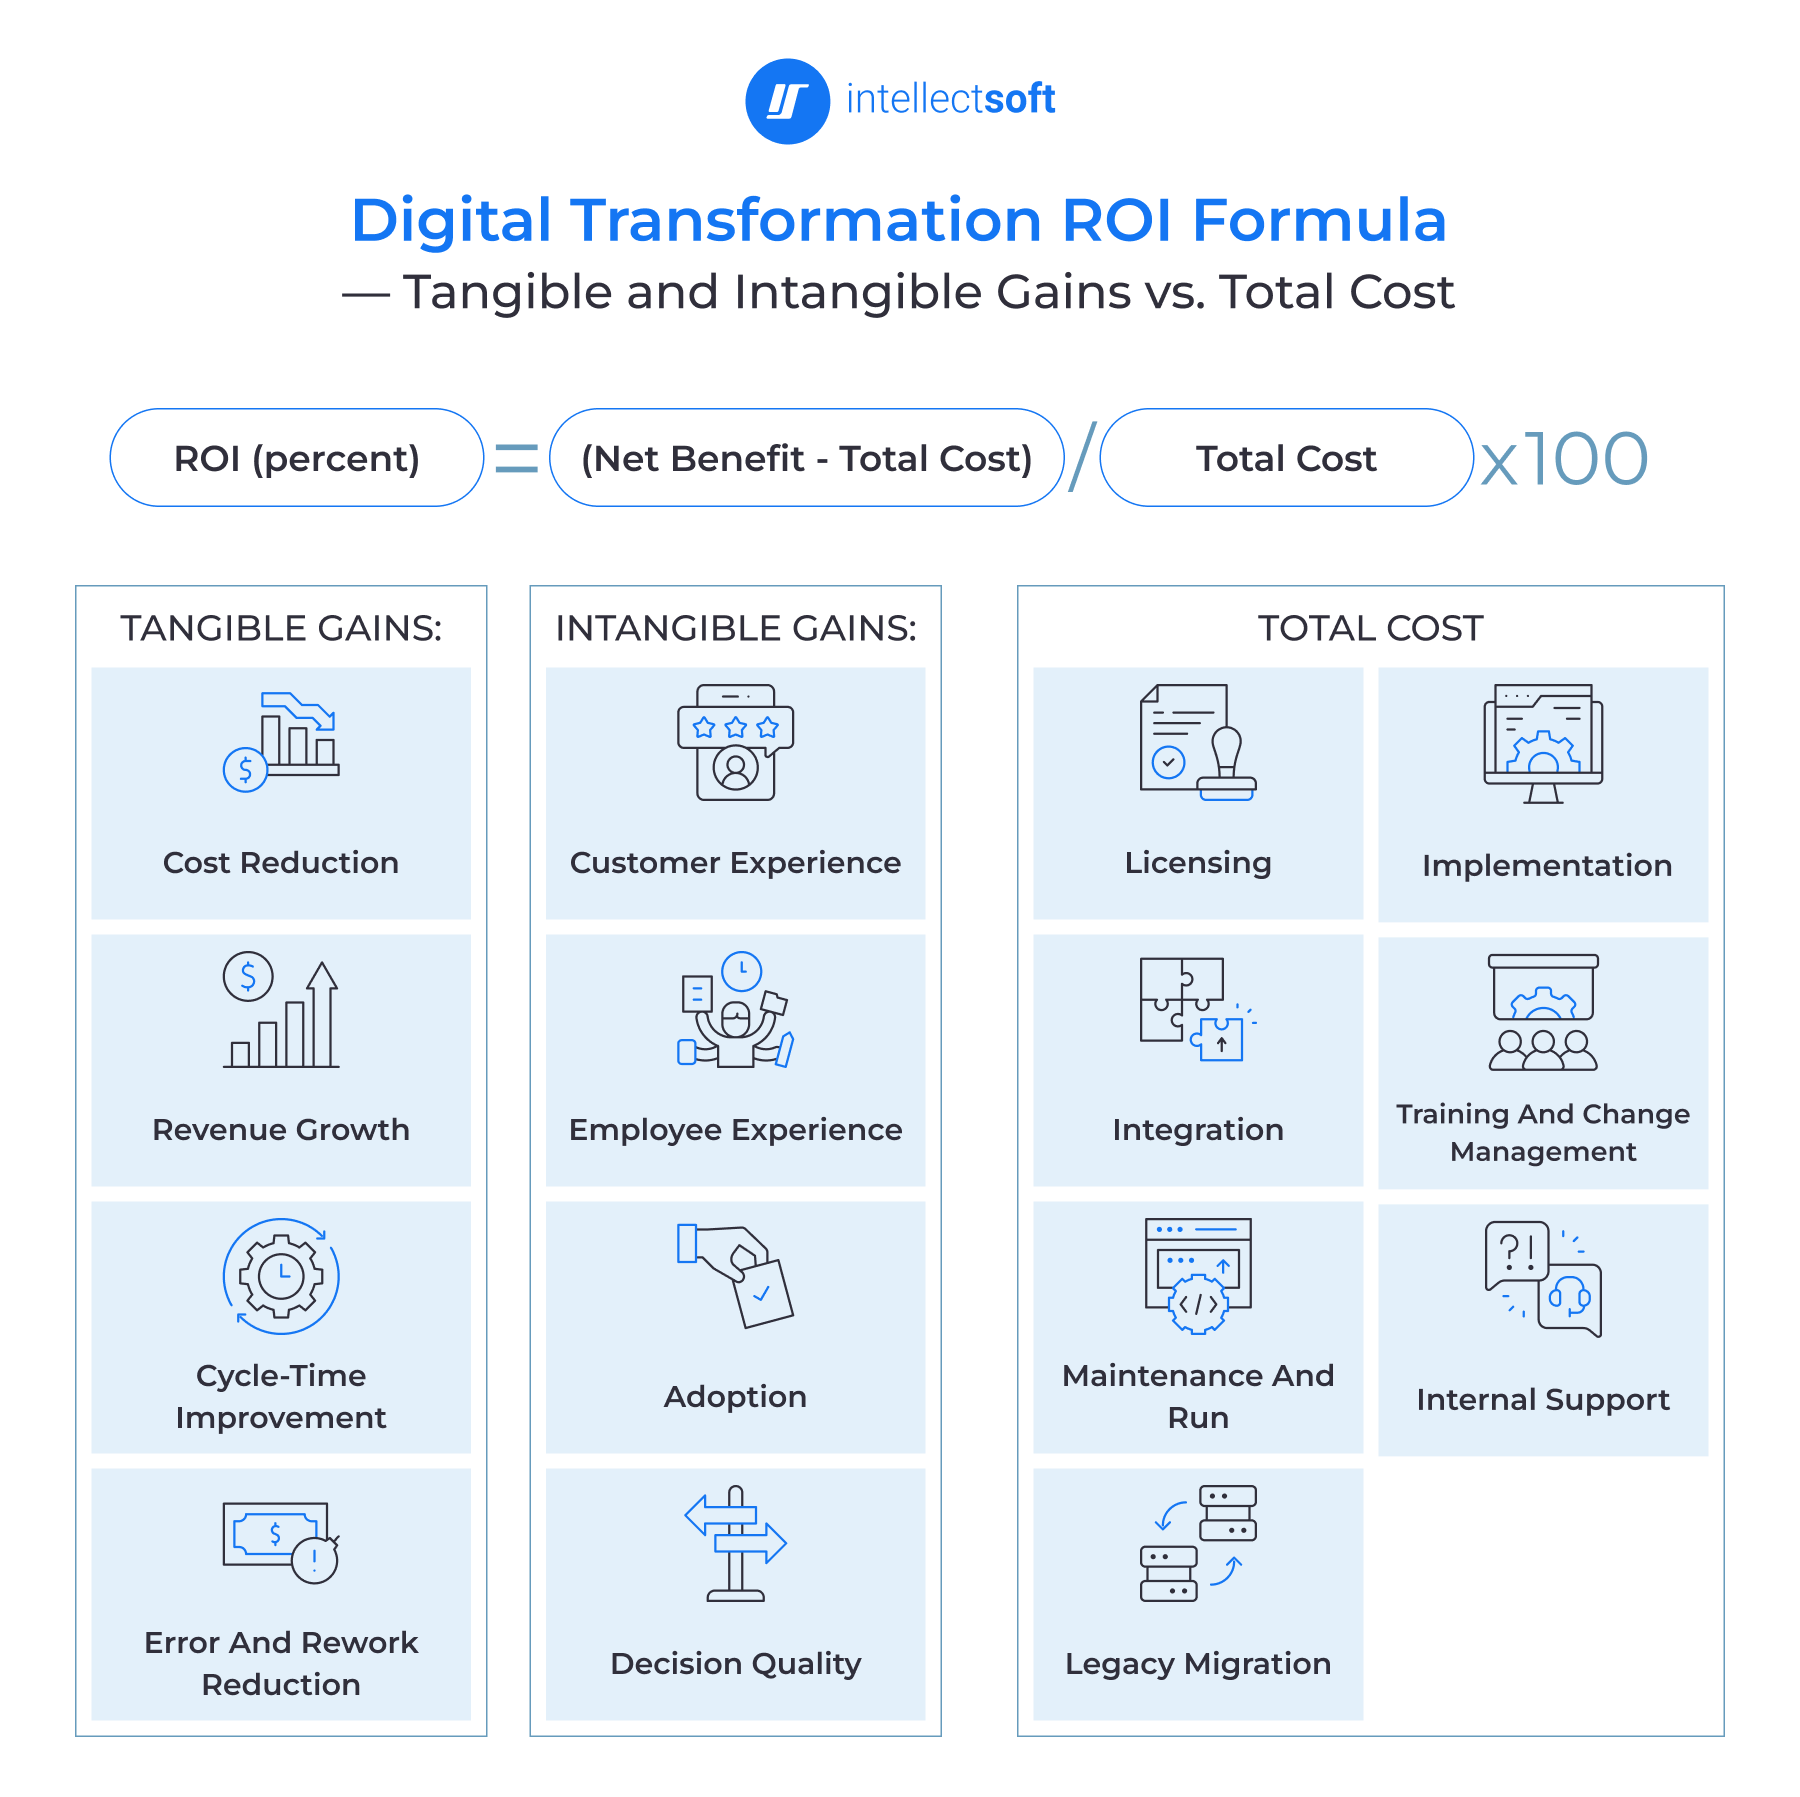
The formula is standard:
ROI (percent) = (Net Benefit − Total Cost) ÷ Total Cost × 100
Net benefit is the annualized value an initiative produces against a dated baseline. Total cost is every category from the ownership model, including the ones that never generate an invoice.
Tangible Gains
Tangible gains carry their own units. Hours, transactions, defects, dollars — each converts to money through a rate finance already publishes. There are cost
- reduction from labor redeployed and infrastructure retired;
- revenue growth from conversion lift and faster quote-to-cash;
- cycle-time improvement at the loaded cost of the people in the process;
- error reduction at a known unit cost.
A worked example, using invoice-processing automation at a mid-market manufacturer. Figures are illustrative.
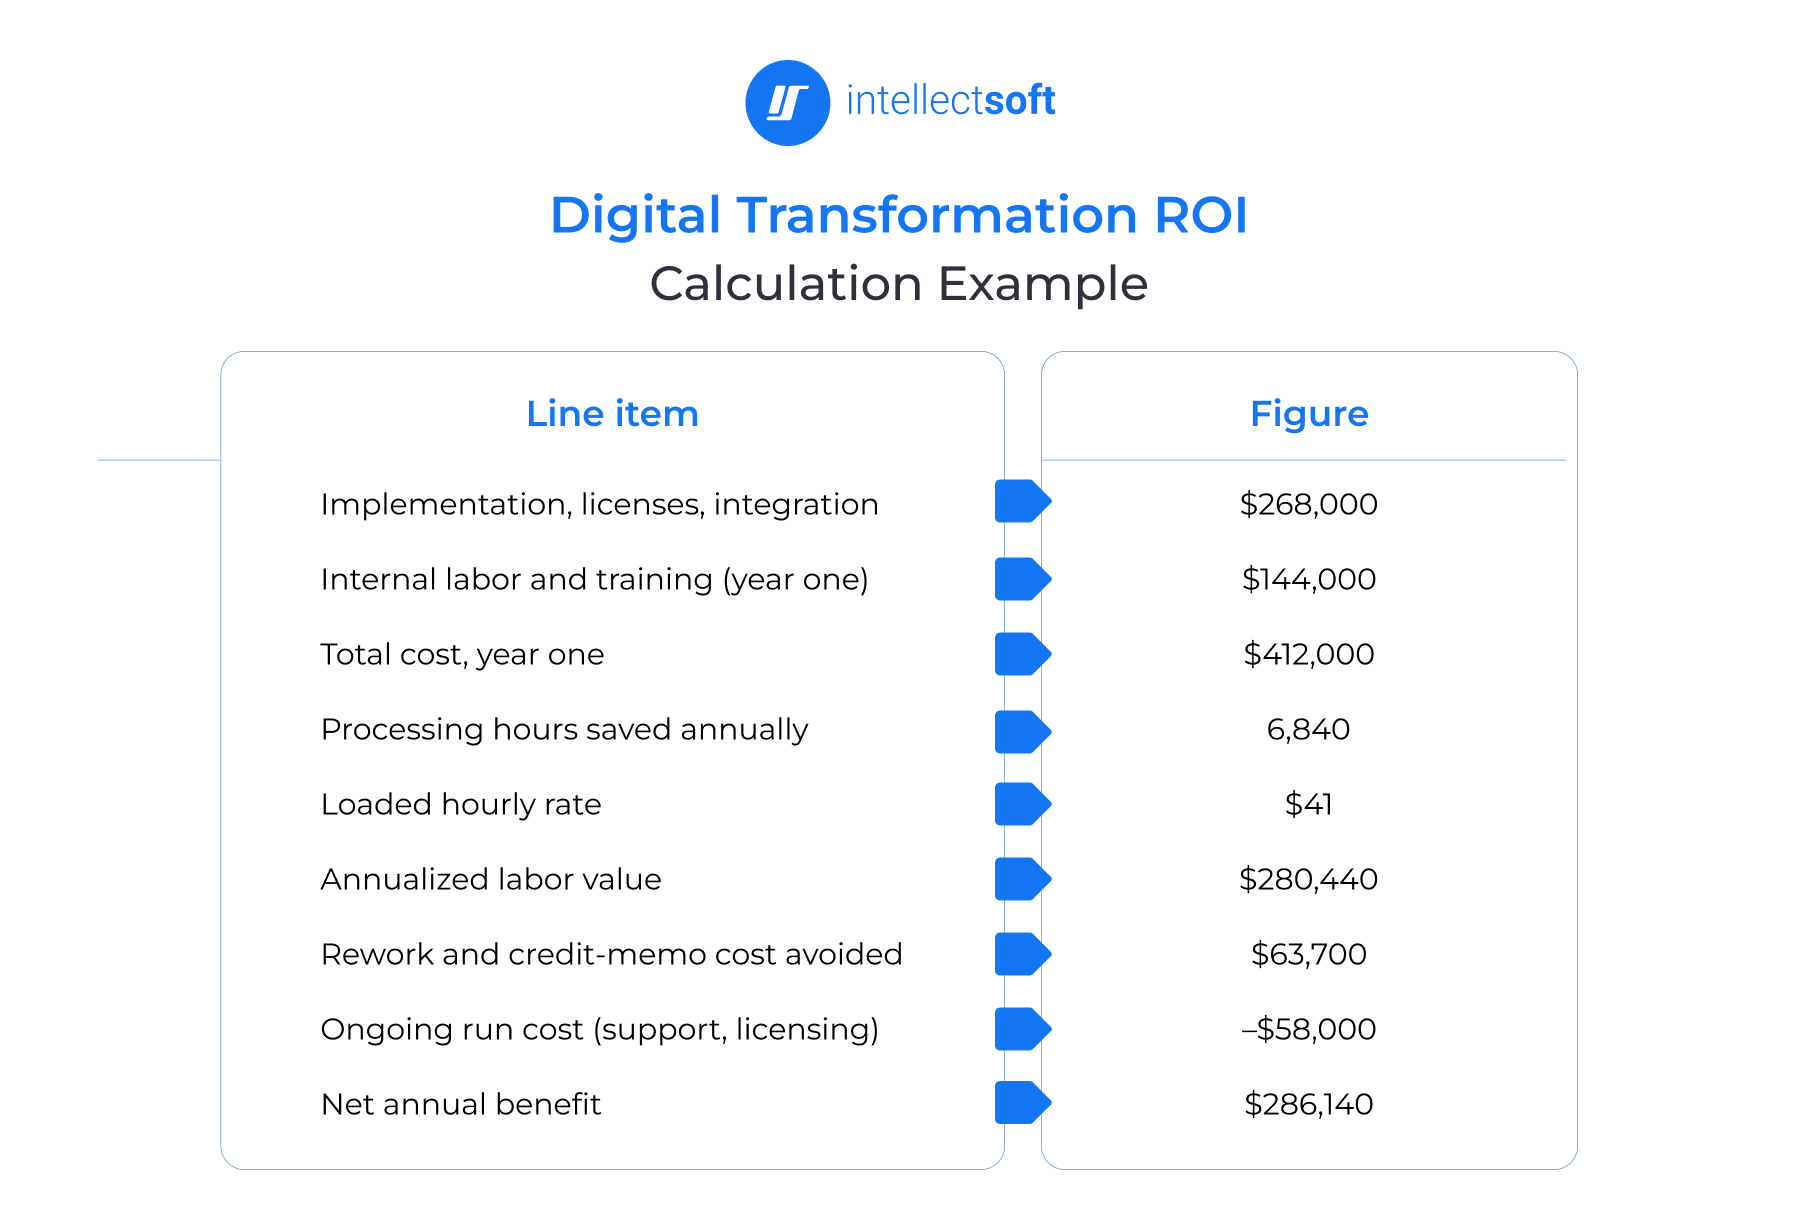
Year one returns negative: $286,140 against $412,000 gives an ROI of minus 31 percent. Over three years, cumulative net benefit reaches $858,420 against the same one-time cost, producing 108 percent. Payback lands at roughly 17 months.
That single-year figure is the one that kills efficiency. The initiative is doing what the model predicted, and the model was only ever shown as an annual number.
Intangible Gains
Customer satisfaction improved. The board wants that in dollars. Everything difficult about intangible benefits lives between those two sentences. Two approaches are defensible, and the choice is about who the model has to convince.
Monetary translation converts each proxy into currency through a stated assumption chain. A four-point CSAT gain maps to churn reduction, churn to retained accounts, accounts to revenue. The output sits in the same model as the tangible gains, which is what a CFO building a portfolio view needs. The cost is fragility: one challenged assumption collapses the whole figure.
KPI-based evaluation reports the proxies as themselves. CSAT moved four points, adoption reached 71 percent at 12 months, and exception handling dropped from 22 percent of agent time to nine. The cost is that these cannot be summed, and a board asking for one figure gets a scorecard.
Track with KPIs, and convert to money only where the assumption chain is short and the underlying rate is already in use elsewhere. A three-step chain invented for the business case will be found.
Total Cost of Ownership
Most disputes about the ROI of digital transformation are about what belongs below the line. Seven components make up a complete one, each with a question that reveals whether it was estimated properly.
- Licensing — what does year three cost after the negotiated ramp expires?
- Implementation — does the figure include the partner's change-order history, or only the signed statement of work?
- Integration — how many connection points terminate in a system whose owner has not agreed to the work?
- Training and change management — what is the productivity dip, and who pays for the parallel run?
- Maintenance and run — what does support cost once the implementation partner leaves?
- Internal support — how many hours from named people at loaded rates, none of whom submit an invoice?
- Legacy migration — what does moving the data cost after profiling reveals its condition?
The last one most often breaks a business case. A program that budgets three months of overlap and runs 11 has absorbed enough unplanned expense to move the ROI figure by double digits. Run this checklist before approval of digital transformation.
How to Measure ROI of Digital Transformation: Step-by-Step Framework
Programs that can defend their budget share one trait: measurement built into the work rather than assembled before a review. The six steps below turn the formula into a repeatable process.
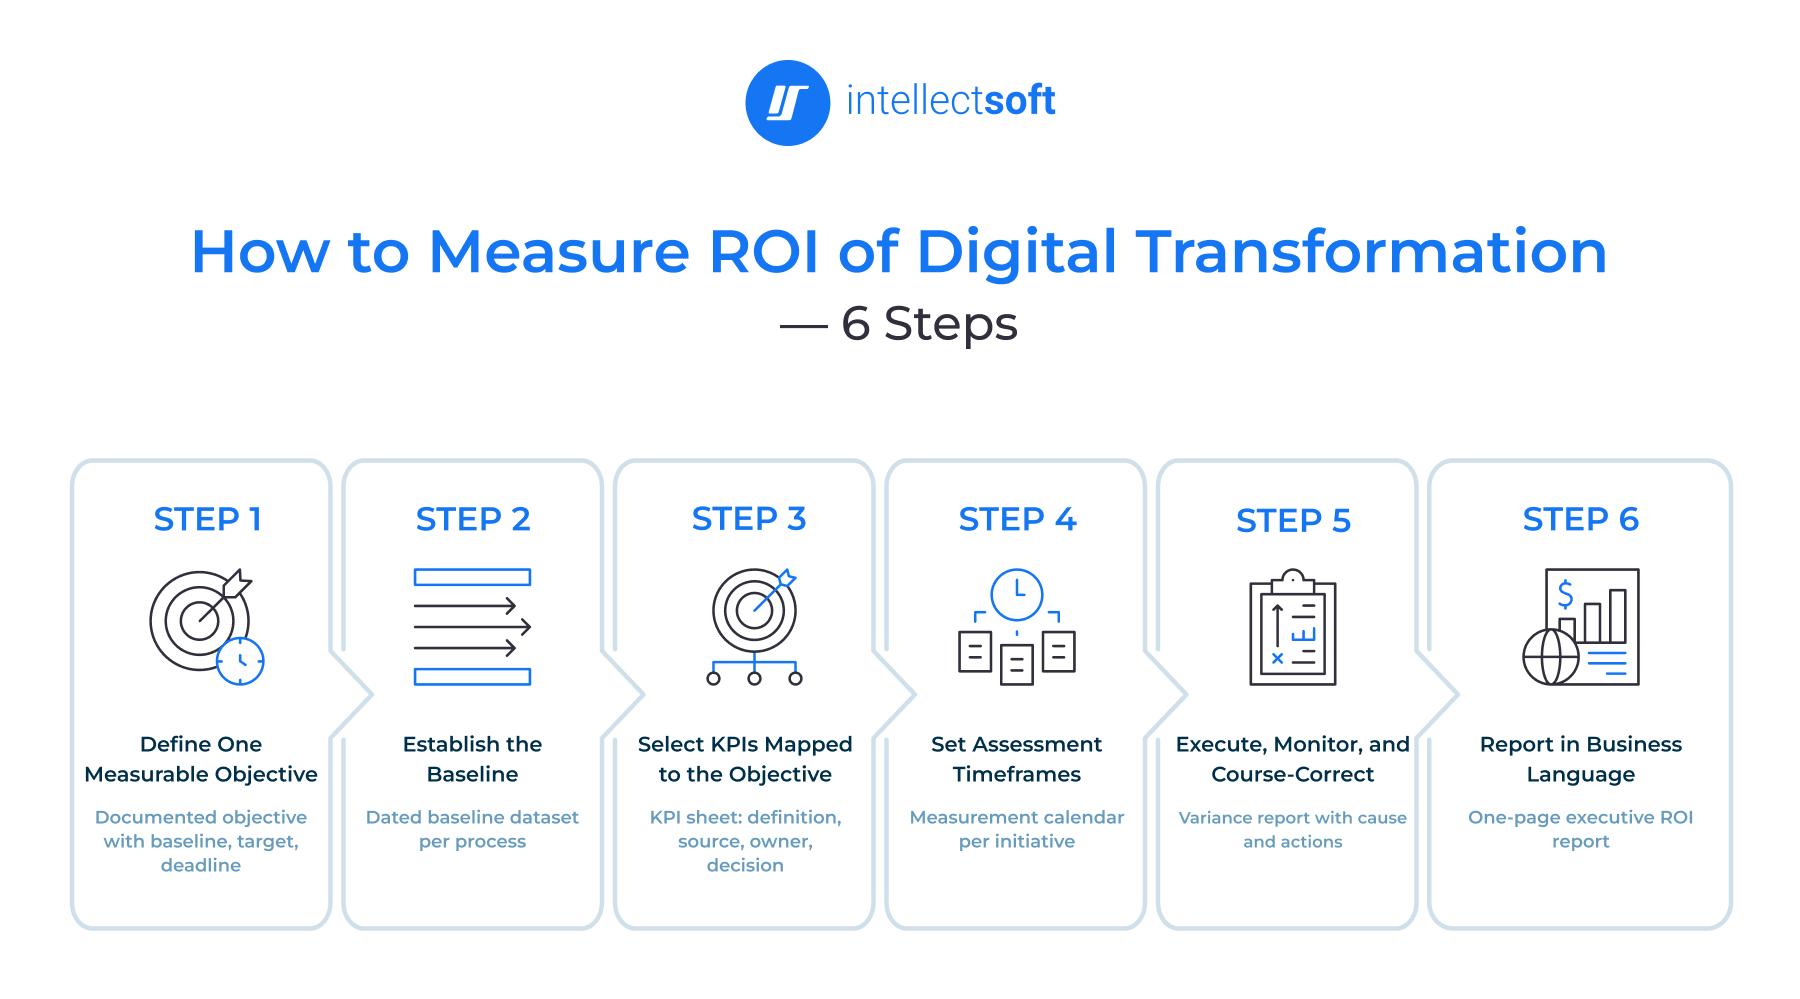
1. Define One Measurable Transformation Objective
One objective per initiative. Improving operational efficiency fails for a specific reason: nothing about it can be false. Any outcome can be described as better efficiency after the fact, so it cannot be used to decide whether to continue funding. That is the only job an objective has.
A usable one states the metric, the current value, the target, and the date:
The qualifier closes the gap that would otherwise let a change in order mix look like an improvement. Where an initiative serves more than one outcome, name one as primary and track the rest as secondary.
As an output, you will get a documented objective with metric definition, baseline, target, and deadline, signed off by the business owner accountable for the result.
2. Establish the Baseline
A baseline captured after go-live is a reconstruction, and finance treats it as one. This step gets skipped more than any other, because it sits between funding approval and the work everyone is impatient to start.
Measuring four dimensions for a digital transformation is a must before anything changes. Cost, including loaded labor per transaction and the internal cost of errors; cycle time end to end, including queue and approval waits; volume and mix by type. Also, there are quality, covering error rates and manual exceptions.
Capture at least one full business cycle, longer where the process is seasonal. Pull from systems rather than estimates. So, ask a team how long a process takes and the answer describes a good day, while system timestamps do not have good days.
These efforts are needed to build a dated baseline dataset per targeted process, with definition and source system recorded for each metric.
3. Select KPIs Mapped to the Objective
Selecting KPIs is an IT strategy consulting task rather than a reporting one. Every KPI on the sheet has to answer one question: what would we do differently if this number moved? Metrics failing that test still cost something to collect, and they crowd out the ones that matter.
Strategy&, part of PwC, groups digital ROI into six strategic focus areas, and the set works as a coverage check:
- Clients — customer satisfaction and retention movement, plus the behavioral measuring behind them.
- Employees — adoption, retention in affected roles, time on exception handling.
- Operations — cycle time, cost per transaction, throughput, error rates.
- Safety and soundness — incident rates, compliance findings, audit exceptions, security events.
- Infrastructure — availability, deployment frequency, technical debt retired, capacity headroom.
- Disruption and innovation — new capabilities enabled, time from concept to production.
Not every initiative touches all six, and forcing a metric into an empty row produces a number nobody uses. Keep the set small: six to 10 KPIs per initiative is workable, and 30 guarantees nobody reads past the first page. Each digital transformation needs a calculation including exclusions, a source system, a named owner, and the decision it informs with the threshold that triggers it.
As a result, you will bring a KPI sheet per initiative with definition, source, owner, and the decision each metric informs.
4. Set Assessment Timeframes
Two questions decide the calendar: when will this initiative plausibly produce a signal, and when does the funding decision get made? The gap between those dates is where programs get cut early.
Point automations take monthly checkpoints with the first meaningful read at 90 days. Function-level digital transformation takes quarterly reviews, the first two reported as implementation progress rather than return. Enterprise programs take quarterly leading indicators against a 12- to 24-month horizon.
Leading indicators run on the fast cadence: adoption, usage depth, defect trends, milestone completion. They are the only honest thing to report in the first two quarters of a platform program.
Lagging indicators run on the horizon: cost per transaction, cycle time, revenue, margin. Asking for them early produces a number built on partial data, which anchors expectations for the rest of the program.
Agree the dates before the work starts. A checkpoint that pauses funding if adoption sits below 50 percent at month six is a control. So, it protects the initiative as often as it kills one.
5. Execute, Monitor, and Course-Correct
At each checkpoint of digital transformation, compare the current measurement against the baseline using the definitions from step two.
The plan was optimistic. The target assumed 80 percent adoption by month four, and the realistic figure for this kind of process change is closer to half that. Execution of digital transformation is fine. Reset the target and say why.
Execution is behind. Something is blocking a reasonable target: an integration that slipped, a business unit that never released its expert, training that reached 60 percent of affected staff. Fixable, with a named owner and a date.
The assumption underneath was wrong. The system works, adoption is high, and the benefit has not appeared, because the bottleneck was never in the automated step. This is the expensive one, and it is most often mistaken for the second.
You need this to make a variance report per checkpoint, naming the diagnosed cause, the corrective action with its owner and date, and any approved revision to the target itself.
6. Report in Business Language
Server response times mean nothing to a board. The cost of the orders that failed while response times were high means everything. The final step in how to measure ROI of digital transformation is a translation problem.
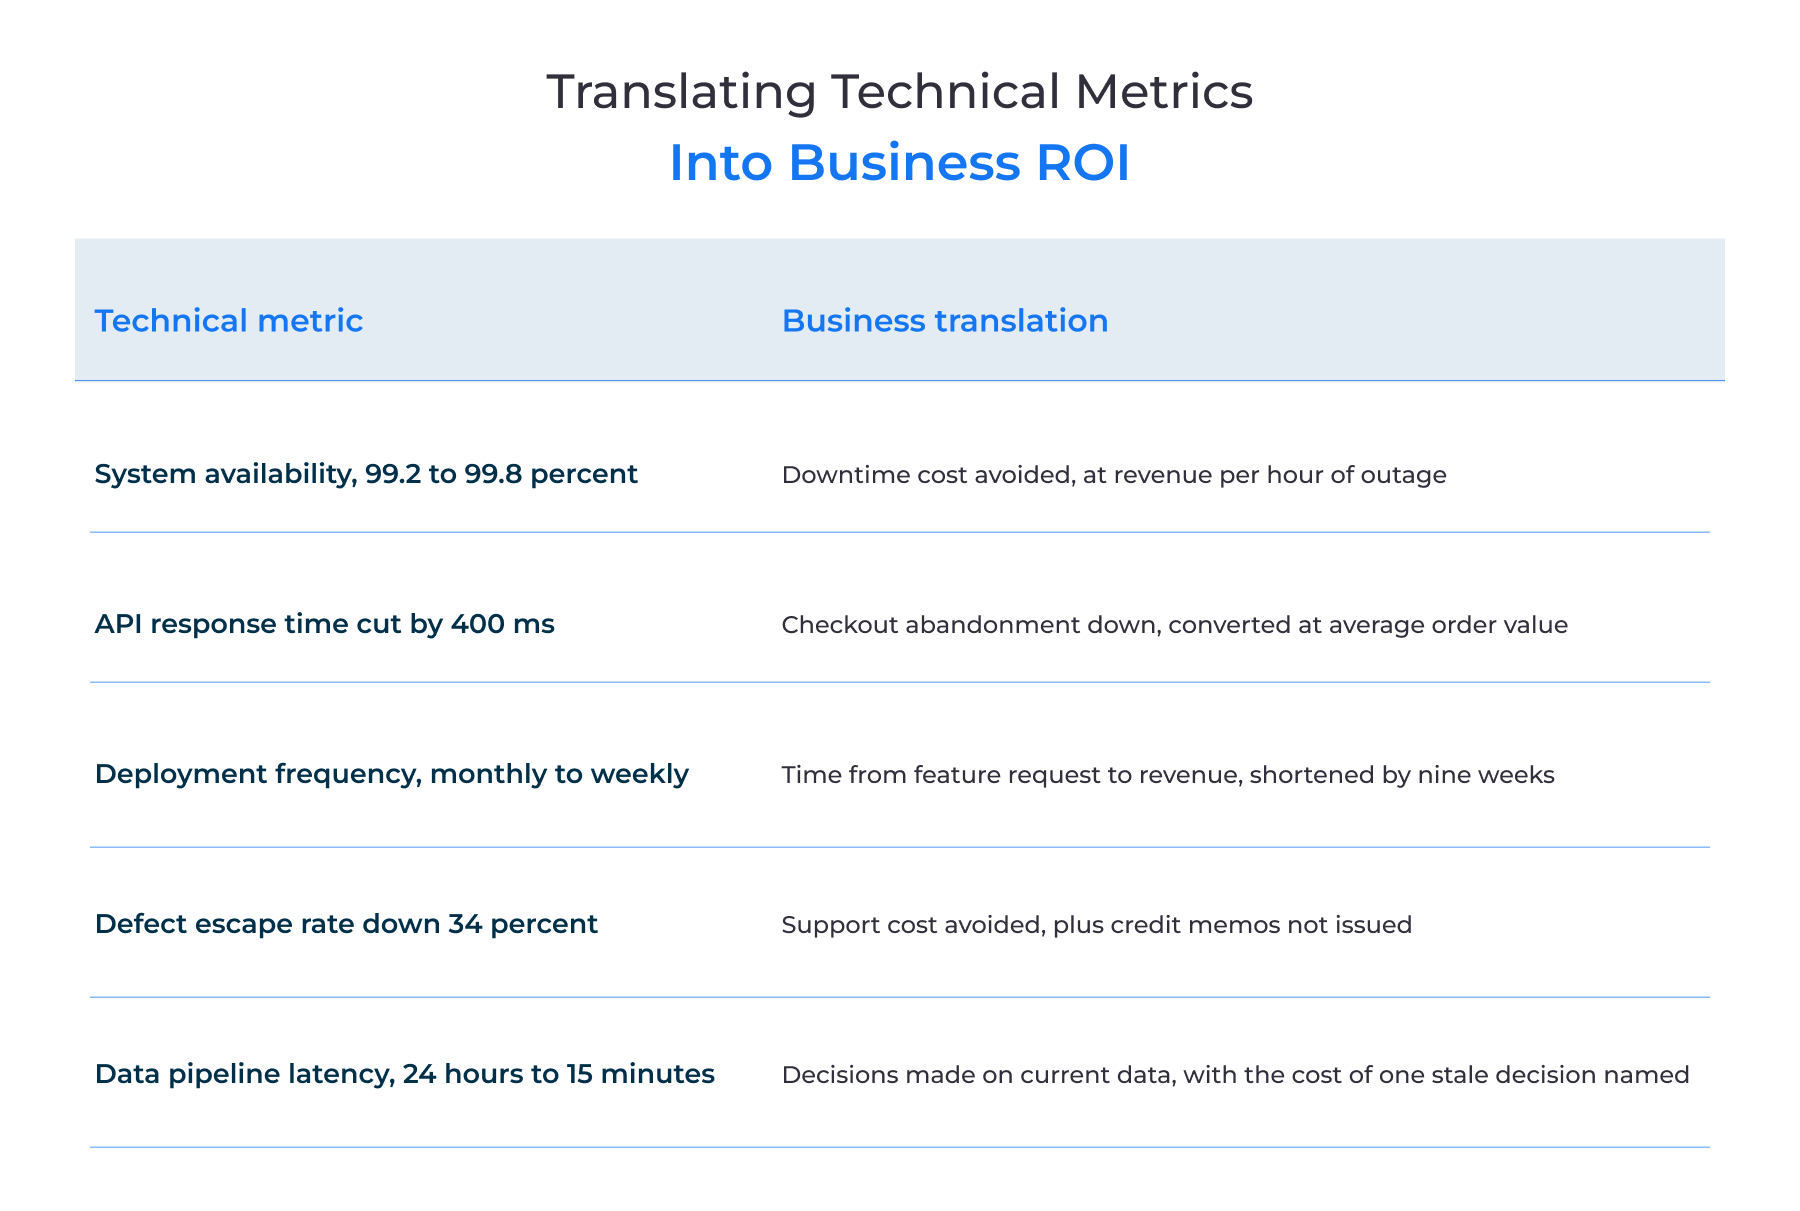
Keep the executive report to one page: the objective and where it stands, ROI to date and projected with the payback month, the business KPIs that moved. Also, you will know what is off track and why, and the decision being requested.
It will help you to outline a one-page executive ROI report per program, with technical detail available but separate.
Digital Transformation ROI Metrics and KPIs to Track
No single metric captures transformation value. Cost per transaction misses customer impact. Satisfaction scores miss the margin. But a balanced set across six categories holds up when one number is challenged, and it exposes the trade-offs a single figure hides.
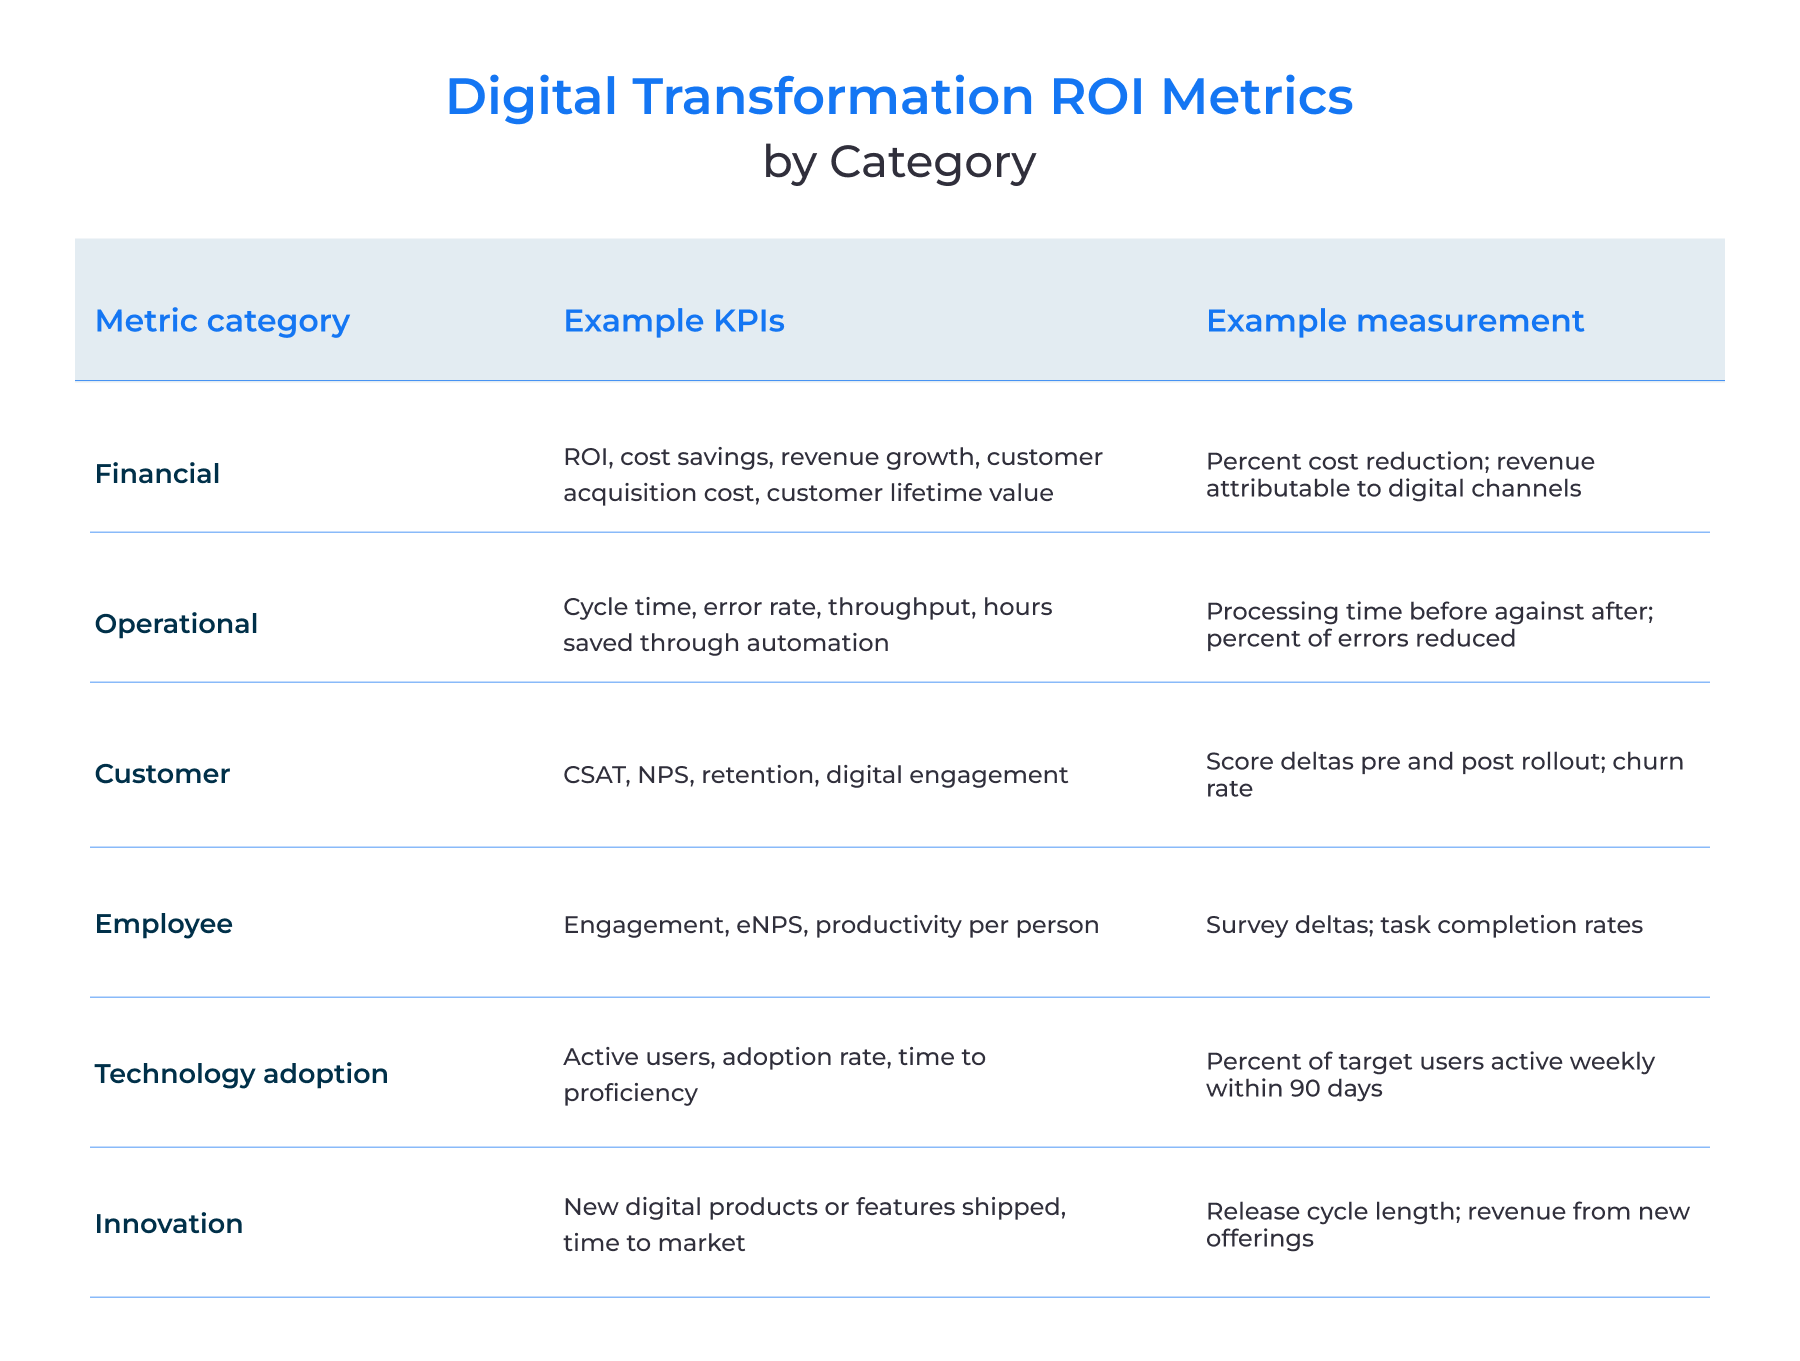
The examples of digital transformation below use illustrative figures.
Financial Metrics
A distribution company consolidated four regional order systems onto one platform. Spend on the retired systems ran $317,000 annually, with support contracts adding $89,000. Against a new platform cost of $205,000 per year, the net annual saving is $201,000 — traceable to canceled contracts rather than estimated productivity.
Operational Metrics
Invoice handling at a logistics operator ran five days end to end, with 2.4 hours of hands-on processing per invoice. Automated intake and coding brought that to 0.7 hours. At 14,600 invoices a year, that is 24,820 hours removed annually. The five-day cycle also dropped to one day, which mattered separately: early-payment discounts the company had been forfeiting became reachable.
Customer Metrics
A score that moves without a behavior moving is a survey artifact. A B2B services firm launched a self-service portal and saw CSAT rise from 7.4 to 8.6 within two quarters. Read alone, that is a soft claim of customer experience. Alongside it, support ticket volume per account fell 31 percent, and renewal rate on accounts using the portal ran six points above accounts that never activated.
Employee Metrics
After a field service platform rollout, technicians spent 18 percent of the workday on paperwork, down from 34 percent. Across 140 technicians, that is roughly 31 additional productive hours each per quarter. This a capacity the company could bill or use to cut overtime.
Technology Adoption Metrics
Active users at 30 days measures launch communications. Active users at 12 months measures whether the system replaced the old way of working or now runs beside it. A rollout reaching 84 percent at 30 days and 52 percent at 12 months has a problem the launch number hides completely.
Innovation Metrics
Time to market is the cleanest measure. A retailer shipping features on a nine-week cycle before replatforming and a three-week cycle after has a number the board understands immediately. A capability that shipped and that no business unit adopted is not a return.
ROI of Digital Transformation for Enterprises
Enterprise transformation is not a larger version of a departmental project. Dozens of programs run at once, returns land on multi-year horizons, and the data needed to prove any of it sits in units with their own definitions. Add board-level accountability, and enterprise ROI depends less on calculating one return than on making a hundred separate calculations comparable.
Portfolio-Level Measurement Across Initiatives
An enterprise running 30 initiatives across six business units does not have one ROI. It has 30, computed against 30 baselines, in units that may not add up.
Roll-up fails in a specific way. Two business units both report cost per transaction. One includes allocated overhead, the other does not. Summed, the total is wrong by an amount nobody can quantify without going back to the source.
Three conditions make a portfolio view hold together:
- Shared definitions above shared tooling — one dictionary entry per metric, binding on every unit, with local variants recorded as variants.
- Baselines that stay attached — each figure travels with its date, source system, and scope so that a portfolio number can be decomposed.
- A stated aggregation rule — how shared gains are split, and whether platform investment rolls up at all.
Governance and Data Readiness as Prerequisites
Ask when a transformation's measurement problem started, and the answer is usually months before the program did. Three things have to be settled before any initiative claims a number: one accountable owner per metric with authority to arbitrate when two systems disagree, one written definition with calculation and exclusions, and an accepted error tolerance per source system.
Poor governance produces a distinct failure pattern: numbers that look fine until someone checks them. An initiative reports a 22 percent reduction in processing cost. Finance pulls the general ledger and finds 9 percent. Both came from real systems. They disagree because the initiative counted redeployed labor hours as savings while finance counted only spend that left the building. Neither team did anything wrong, and the claim is dead regardless.
Legacy Modernization in the ROI Base
A mid-market company buying a new platform is buying a platform. An enterprise buying the same platform is buying it plus 20 years of accumulated dependency on the thing it replaces. That difference sits entirely in the denominator, and it is the most common route to an overstated enterprise ROI figure.
Four cost categories separate enterprise digital transformation from a greenfield build:
- Integration with systems that are not moving — the replaced application feeds a warehouse system, a regulatory report, and two analytics platforms, none in scope and all needing new connections.
- Data migration after profiling — profiling finds duplicate customer entities and a decade of transactions the new schema does not accept.
- Parallel operation — both systems staffed and reconciled until the old one is decommissioned, a period that reliably outlasts the plan.
- Decommissioning — retention requirements, contract exit terms, and the specialist knowledge to shut down a system only two people still understand.
Reporting Transformation Value to the Board
Boards defund the projects that arrive at the review with a single number and no way to interrogate it. Deloitte's study of 1,600 leaders mapped 46 value KPIs across financial, customer, process, workforce, and purpose categories, then grouped respondents by how many they actually used. The most comprehensive group, which Deloitte labels "All-in," was as much as 20 percent more likely than the narrowest group to attribute medium-to-high enterprise value to its transformations.
Frame the horizon in the same conversation, every time. Enterprise-wide value lands on a 12 to 24 month curve, longer where core financial or regulatory systems are in scope. A board told this in month zero reads a flat month-nine report as expected. The same board, told nothing, reads it as failure. Enterprise ROI is more often lost to an early funding decision than to the technology underneath it.
How to Maximize Digital Transformation ROI
Measurement shows what a program returned. The levers below change that number before it gets measured. They are largely what separates the 30 percent of transformations that meet their targets from the seventy percent that fall short. Most cost nothing beyond the discipline to apply them.
Set Measurable Targets Before Investing
Fix the target value and the date before procurement opens. A target set first determines what gets bought, while a target set later has to accommodate what was already bought. The marker of doing it right: the annual value of hitting the target is written down before any vendor is shortlisted, because that figure is the ceiling on justified spend. An objective worth $340,000 a year does not support a $900,000 three-year program.
Prioritize High-Impact Automation First
Sequence the roadmap so high-volume, repetitive, error-prone processes come first. Programs showing a return in year one buy the political capital for work that returns in year three, and programs starting with the hardest thing tend to end there. The marker is a ranking built on frequency multiplied by handling time multiplied by error cost rather than volume alone. And where variation defeats fixed rules, the work belongs to AI development services rather than a workflow tool.
Invest in Adoption and Change Management
Fund training, communication, and champion networks as deliverables rather than overhead. A platform used by 40 percent of its intended users returns roughly 40 percent of its business case, and the licenses cost the same either way. The positive point is an adoption target with a named owner, checked at 30, 90, and 365 days rather than only at launch.
Track a Balanced Scorecard, Not Vanity Metrics
Report outcomes rather than outputs: time to resolution instead of tickets closed, weekly active users instead of licenses provisioned. Output metrics move early and reliably, which makes a status deck look healthy in the quarters before any outcome exists. The marker is a scorecard where every line names a business consequence. Deloitte found 81 percent of organizations lean on productivity as their prime measure of transformation ROI, which is exactly the over-indexing that hides what a gain cost elsewhere.
Cut Initiatives That Miss KPI Milestones
Agree at kickoff what triggers continue, adjust, descope, or stop, then apply the rule when the checkpoint arrives. Continued funding of a failing program is negative ROI chosen deliberately, and portfolios erode through a series of small extensions rather than one bad decision. The marker is a portfolio where something has actually been stopped on its own evidence. Sunk cost pulls hard at $2 million spent and a rule set before anyone is invested is what survives that pull.
Work with an Experienced Implementation Partner
Bring in a team that has run the same class of program before, since most transformation failures trace back to execution rather than strategy. There are the sequencing, the integration assumptions, the data condition nobody profiled. Experience shows up as fewer change orders and a business case that still resembles the original one at month 18.
Those are the questions Intellectsoft's IT consulting services are built to answer, on enterprise programs for customers including Jaguar, Eurostar, and EY. The architects and engineers on those engagements track the business metrics alongside the code. That is what makes a course correction possible on the first weak signal, rather than after a second missed quarter.
Digital Transformation ROI in Practice
We will show two cases of digital transformation and customer experience improvement, delivered by Intellectsoft.
Naked Energy: Collapsing the Quote Cycle for Solar Thermal Systems
Naked Energy designs solar thermal systems delivering zero-carbon heat and power to rooftops, facades, and open sites. Their mission is serving hospitals, housing developments, and manufacturers with high heat demand.
Producing a customer proposal meant moving between CAD files, spreadsheets, and simulation tools. The process was accurate and slow. New team members took considerable time to become productive, customers waited, and only technical staff could complete a full design.
Intellectsoft built a cloud-based platform consolidating the workflow into one session. Users open a 3D workspace from a single dashboard, model layouts on rooftops or open land, and see the configuration update in real time. Built-in calculations handle energy output, sizing, and pricing, with data connected behind the scenes.
Because of digital transformation, proposal creation time fell 70 percent. The sales cycle shortened by 40 percent. Five tools collapsed into one platform. Non-technical team members can now produce a full proposal without engineering support, which removes a capacity constraint on how many opportunities the company could pursue at once.
Dental Clinic CRM: Administrative Time and Schedule Utilization
A UK startup building for the dental sector needed a platform covering onboarding, appointment management, consultations, and patient records.
Clinic administration ran on manual coordination. Scheduling, patient intake, and urgent request handling each consumed administrator time that scaled directly with patient volume, capping how many patients a clinic could serve well.
Intellectsoft provided a digital transformation in nine months: a responsive web application for patients alongside an admin panel with multiple access levels and roles. Managers create profiles, handle appointments, and pull patient statistics from one interface. Patients select dentists, schedule appointments, complete questionnaires, and submit requests without contacting the clinic.
Administrator time per patient dropped roughly 20 percent. Revenue rose an average of 8 percent through improved schedule utilization, since better appointment management converts existing clinical capacity into billable hours without adding staff.
Why Intellectsoft for Digital Transformation
Intellectsoft has spent more than 18 years building software for organizations where the result has to hold up under audit, including 35 Fortune 1000 companies, with the outcomes recorded in our client case studies. That work covers the full cycle: strategy and architecture, implementation, digital transformation of systems that predate the current stack, and the measurement structure that shows what any of it returned.
Architecture comes first in every engagement, which prevents decisions made for speed in month two from constraining every program built on the platform afterward.
Industry depth shapes what that architecture looks like in practice:
- Fintech — regulatory reporting, audit trails, and transaction integrity as design constraints rather than later additions
- Healthcare — patient data handling, clinical workflow, and integration with systems that cannot be taken offline
- Construction — field operations, project and asset data, and the gap between site conditions and back-office systems
- Logistics — order and inventory flow, real-time visibility, and throughput requirements that surface only at peak volume
Talk to our team about your transformation program, and we will help you define the baseline, the targets, and the digital transformation ROI structure before the first line of code is written.
FAQ
How to calculate ROI for digital transformation?
The formula is: digital transformation ROI = (Net gain − Cost of investment) ÷ Cost of investment × 100.
Net gain includes tangible returns finance can audit — cost savings, revenue growth, hours removed from a process — plus intangible value proxied through adoption or satisfaction, converted with the assumption chain stated rather than hidden. Cost of investment means total cost of ownership: licensing, implementation, integration, training, change management, internal labor, maintenance, and legacy migration, and most business cases price the first three while skipping the rest.
How to measure ROI of digital transformation?
Define one measurable objective per initiative, with a target value and a deadline.
Baseline the current process — cost, cycle time, volume, quality — before anything changes.
Select KPIs that map to the objective and inform a real decision.
Set assessment timeframes that match the initiative type.
Monitor against the baseline at each checkpoint and diagnose any gap.
Report in business language: cost, revenue, risk.
Without a baseline captured before implementation, efficiency cannot be proven later.
How do enterprises measure the ROI of digital transformation?
Enterprises measure at portfolio level rather than initiative level, rolling individual results up into a single view. That only holds if every business unit works from the same KPI definitions, each initiative keeps its own dated baseline and source system, and legacy migration and parallel-run costs sit in the denominator. Enterprise-wide value typically lands on a 12 to 24 month horizon, longer where core financial or regulatory systems are in scope.
How long does it take to see ROI from digital transformation?
Efficiency depends on how much the initiative touches. A single automated process — invoice intake, order validation — can show a measurable return in one or two quarters. Core system digital transformation and cloud migration need 12 to 24 months, with the first two quarters reporting cost and nothing else, and longer still where regulated systems are in scope. Baseline quality decides the rest: skip the pre-implementation capture and no amount of elapsed time produces an answer anyone will accept.
What are the key digital transformation ROI metrics?
There are six crucial categories for a digital transformation.
Financial — cost savings, revenue growth, ROI itself.
Operational — cycle time, error rate, throughput.
Customer — CSAT, Net Promoter Score, retention.
Employee — engagement, productivity, retention in affected roles.
Technology adoption — active users against eligible users, measured at 30 days and again at 12 months.
Innovation — time to market, revenue from new offerings.
Track all six metrics or the trade-offs stay invisible. An automation that cuts cost per transaction 22 percent while pushing exception volume onto an overloaded team looks like a win in the financial row and nowhere else.
Why do digital transformation initiatives fail to deliver ROI?
Objectives too vague to falsify, no baseline captured before implementation, low adoption of the delivered system, hidden costs missing from the business case — any of these produces a program that may well be working while nobody can prove it. For digital transformation, the fix for all four is timing rather than technique. So, for operational efficiency, set the target value, capture the baseline, price total cost of ownership, and fund adoption with a named owner before procurement opens, since none of them can be added retroactively.
